As we have reached the half-way point in the 2015-2016 campaign, it is time to test the predictive value of the A-SCoRe model. We will compare the projected final tables generated by SCoRe and A-SCoRe with the projected final tables of the Euro Club Index, ClubElo and 11tegen11’s Expected Goals Model (@11tegen11 on Twitter).
Euro Club Index & ClubElo
The Euro Club Index and ClubElo both use historical and actual sporting results as input for each teams ELO rating. The impact of more recent games if of course higher than that of older games.
Before every match the probabilities of the three match results (home team win, draw and away team win) are calculated. These probabilities are calculated using the current difference in ELO ratings between the two teams adjusted with home field advantage. The amount of ELO points a team wins or loses from a game depends on the actual outcome compared with these probabilities. So, when Team A was the clear favourite to win the match versus Team B, because team A had a much higher ELO rating, they will gain only a small amount of ELO points when they win. Whilst Team B could have gained a lot of ELO points by winning the game, because they were not expected to win. Teams always exchange ELO points, which means that the amount of ELO points won by Team A is the same as the amount of ELO points lost by Team B.
The ELO ratings are used to calculate the expected amount of points a team will gain in the remaining games of the season. This sum is added up with the current amount of points achieved to come up with the projected final table.
11tegen11’s Expected Goals Model
The above mentioned models only consider results and completely ignore how the game went. However, in football, many games are decided by efficient finishing and quite often the best team does not win. Because of that, I am quite happy that 11tegen11 is willing to share his projections as well. What his Expected Goals Model measures is the amount of goals a team ‘should have’ scored and conceded based on the amount and quality of the chances it had created/faced against. His model uses expected goals, expected goals against, shots, passes, goals and the past season to generate team ratings. These team ratings are used to calculate the expected amount of points a team will gain in the remaining games of the season. This sum is added up with the current amount of points achieved to come up with the projected final table.
SCoRe & A-SCoRe
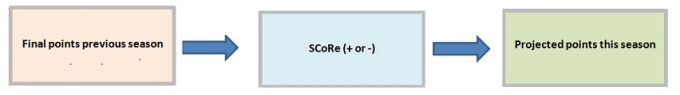
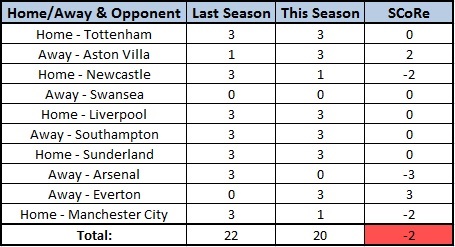
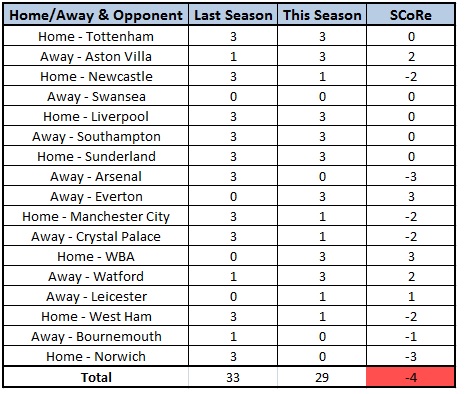
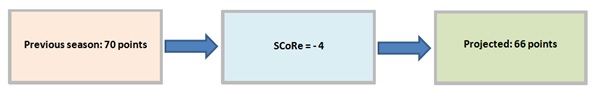
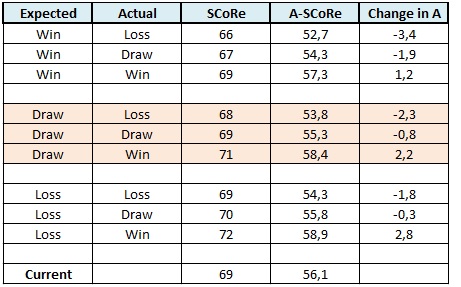
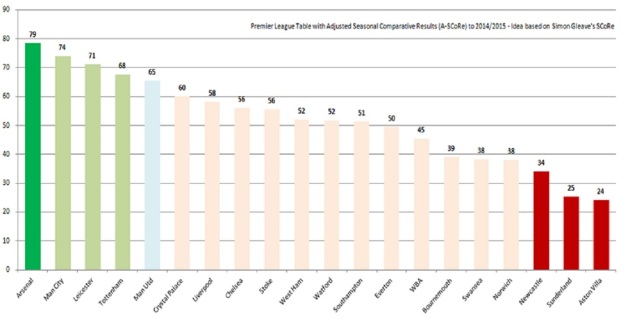
SCoRe, which means Seasonal Comparative Results, is an idea of Simon Gleave (@SimonGleave on Twitter) and implies the difference between the points achieved this season and the points achieved in the equivalent matches in the previous season. For example, if Team A wins at home versus Team B whilst the same game ended in a draw last season, Team A receives a SCoRe of 2 and Team B a SCoRe of -1. As this method does not work with the promoted teams, they take over the points from the relegated teams. The best promoted team gets the points of the best relegated team, the second best promoted team gets the points of the second best relegated team, etc. Contrary to the previous models SCoRe does not use team ratings in its projections. It just takes the final points of each team from the previous season and adds up their current SCoRe to predict the final table.
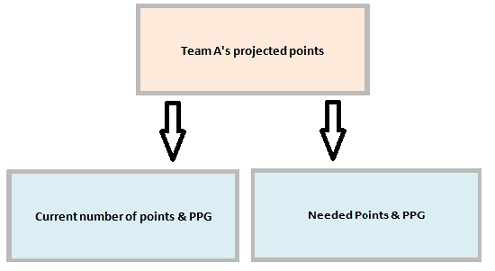
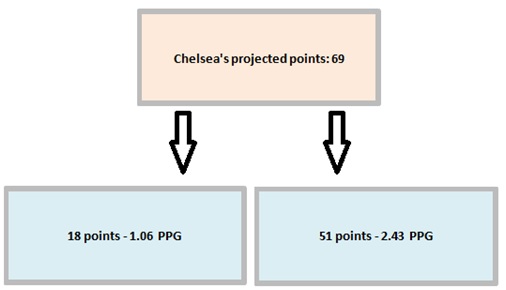
As I thought the predictive value of SCoRe could be improved by making an adjustment, I came up with the A-SCoRe. From the predicted points of each team (using SCoRe) the number of points already achieved is subtracted. This gives you two parts which are the current number of points achieved and the needed points to achieve the projection using SCoRe. From both parts the points per game (PPG) is calculated. Then a weighted average, based on the number of games played and number of games still to play, of the PPG achieved and PPG needed is calculated. This number is used as an estimate for the PPG in the remaining games of the season and will be multiplied by the number of remaining games to calculate the expected amount of points a team will gain in the remaining games of the season. This sum is added up with the current amount of points achieved to come up with the projected final table.
Summary
As you can see, the models differ in the way they calculate the expected points a team will take in the remaining games of the season. The Euro Club Index and ClubElo use ELO-ratings, 11tegen11’s Expected Goals Model uses team ratings, SCoRe uses the amount of points a team achieved last season (in the equivalent matches of the remaining games) and A-SCoRe uses a weighted average of the PPG achieved this season and the PPG needed to end up with the number of points projected by SCoRe.
Projections
We will compare the Premier League, Bundesliga, La Liga, Serie A and Eredivisie projections of the Euro Club Index, ClubElo, 11tegen11’s Expected Goals Model, SCoRe and A-SCoRe. The predictions will be compared on two elements which are:
- Average difference between prediction and actual outcome
- Standard deviation
First we will calculate the average difference between predicted position & outcome and the corresponding standard deviation. After that we will calculate the average difference between predicted points & outcome and the corresponding standard deviation. The average difference between prediction and actual outcome is calculated by dividing the total sum of differences by the number of teams.
Premier League
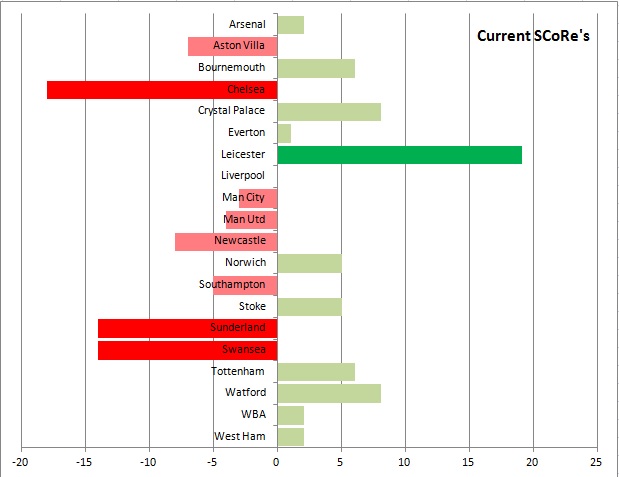
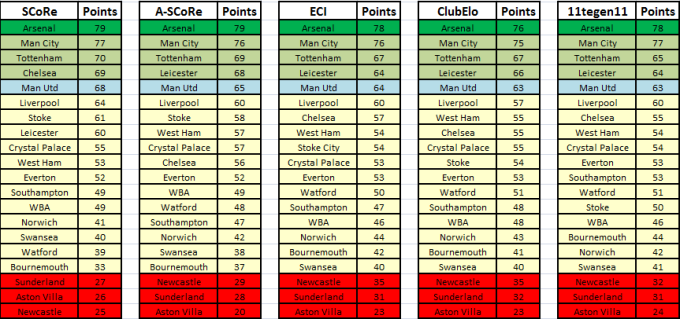
Unfortunately, I was a bit too late with collecting the projections, so these are the projections after matchday 20. First thing to notice is, all five models project the same teams in the same order to end up in the top six. They all expect Arsenal to become champions, but the gap with Manchester City is small. An important remark is that the models predict the amount of points a team will gather by summing up the expected points. As a result they expect Arsenal to end up with less than 80 points, while they probably all agree that the winner of the 2015/2016 title will most likely pick up more than 80 points. The explanation behind this is that one of the teams probably will win more games than expected because of skill and luck, but the models/projections do not know which team this will be. Furthermore, all five models project the same teams to relegate. However, the amount of points these teams are projected to achieve differs.
Bundesliga
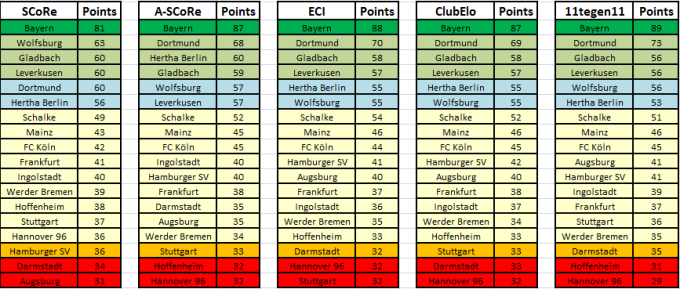
All five models project the same teams in the upper half of the Bundesliga table. However there are some differences, for example SCoRe predicts a quite low amount of points for Dortmund, whilst A-SCoRe seems to overrate Hertha Berlin. In the lower half of the table the projected differences are small and it looks like the relegation battle will be exciting until the very last minute.
La Liga
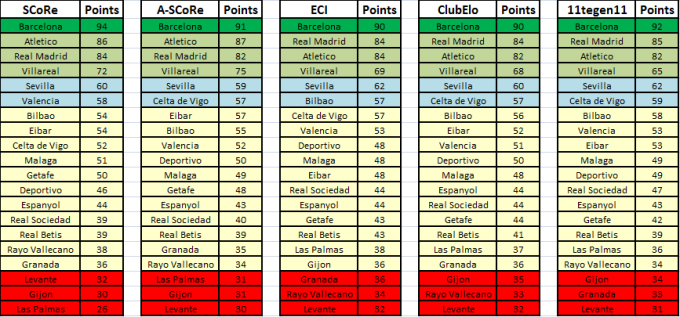
Real Madrid lost quite a lot of points and as a result the title race already seems decided. However, with the announcement of the transfer bans both Madrid teams may be keen on improving their squads in the current transfer window. According to the five models, Villareal, who are enjoying a wonderful season, are favourites to grab the fourth Champions League ticket. However, it seems A-SCoRe overestimates their true level. Based on the projections, there are five teams who are likely to end the season in a relegation spot, which are Levante, Rayo Vallecano, Gijon, Granada and Las Palmas.
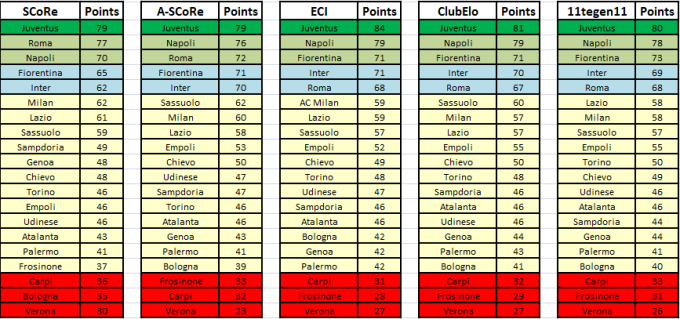
Serie A
Juventus started the season with some terrible results and achieved only five points from the first six games. However, their underlying statistics were actually quite good and finally they started winning their matches. At the moment they are projected to win the title, but they face some strong competition. It is quite some time ago since Napoli won their last Scudetto, but it may actually happen this year with again a brilliant Argentinean striker upfront. At the bottom side of the table, Carpi, Frosinone and especially Verona are in serious danger to get relegated.
Eredivisie
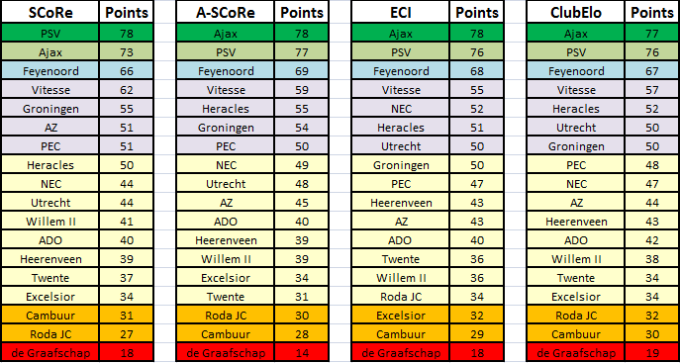
Unfortunately, yet for understandable reasons, we only have four Eredivisie projections as 11tegen11 did not want to share his Eredivisie projection as he will use them soon in an article. If we look at the projections, it seems to be a two-horse race between Ajax and PSV with Feyenoord on an appropriate distance. This year promoted NEC is having an amazing season and are still in the race for a play-off ticket. In relegation land, there are quite a lot of teams who could end up on a play-off spot, whilst de Graafschap already look doomed.
Conclusion
My first hypothesis is that A-SCoRe predicts the final tables more accurate than SCoRe does, as it probably uses a better estimator for the points per game in the rest of the season. Furthermore, I hope that A-SCoRe is able to compete with the other three models, but I expect those models to predict the final table a bit better. Special thanks to 11tegen11 (@11tegen11 on Twitter) for sharing his projections! That’s it for now, it’s time to sit back and watch!
If you want to read more about the five models: